MONTHLY TEMPERATURES
This spring has given us quite a few surpries throughout the months and the following temperature maps as well as precipiation maps and wind maps will give us some understanding into this Spring. As the days progressed the temperatures slowly crept up from below zero with a few dips throughout the spring time. This has been quite an unusual spring as the temperatures have been all over the map.
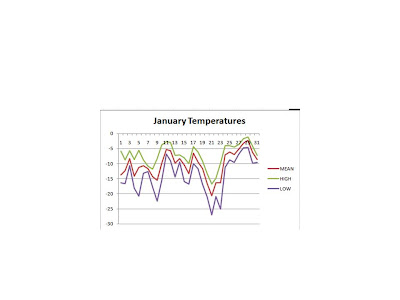


In January we can see that the temperatures started out at a higher degree and actually started to creep up before they drastically dropped and rose again.


In January we can see that the temperatures started out at a higher degree and actually started to creep up before they drastically dropped and rose again.
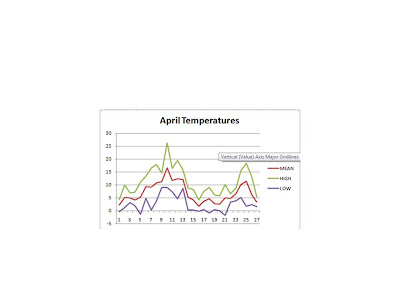
No rain recorded for January. For the remaining months it seems that there is a higher amount of rain as the temperatures increase. For example there is a much higher amount in April than there was in January, which goes hand in hand with the warmer spring weather.


WIND DIRECTIONS


From January to April there have been significant variations in the temperatures, the amount of rain as well as the many changes in wind direction. As the months moved farther into spring the temperatures slowly started to increase and went from below zero temperatures to fair temperatures. However this spring has been quite different from the others. As can be seen on my blog we have had some crazy weather systems these past few months that have dumped snow on us in the middle of March when we thought all of the winter weather was over. This also can be seen on the March rain graph above. The changes in wind direction can be seen easily on the pie charts. Any time there was a wind from the South, Southeast or Southwest some type of weather was sure to follow it. After examining the charts above there is a definite pattern with the wind direction and the amount of rain seen by these areas.